
Revision and update of the Flood Warning Map
On Sunday 4 November 2012, Carinthia and Slovenia were hit by rainfall, which intensified during the night of Sunday 4 to Monday 5 November, particularly in the Karawanks region. Prior to the event, the Drava catchment area in Carinthia was already heavily saturated due to previous rainfall, and there was also a considerable snow cover in the headwaters of the Drava and its tributaries. The rainfall was accompanied by a fairly significant rise in temperature, which further increased the already high runoff by causing the snow to melt. This weather situation resulted in high flows in the River Drava and its tributaries.
The area under consideration
The Drava river basin, specifically the section of the Drava from the Amlach gauging station to the Borl gauging station.
Basis for the analysis
- acquisition and use of available data
- to understand the precipitation and hydrological situation as fully as possible, with a view to actively monitoring the presentation of the Austrian report at the extraordinary meeting of the Slovenian-Austrian Commission for the Drava and, consequently, raising questions to seek further clarification (to improve the report), to take the initiative to improve forecasting and response measures in high-water situations.
Data used
- Reports provided by ARSO
- Data provided by ARSO in digital form (for the Drava catchment area) and suitable for analysis
- Obtained from websites
- Publications
- Data obtained as part of the work of the working group for a further detailed investigation of the flood event in the Drava river basin in the Republic of Austria and the Republic of Slovenia in November 2012
Hydrological analysis
The following data and assumptions were taken into account to present the event on the Drava using discharge hydrographs:
p1. Flow hydrographs at individual cross-sections of gauging stations and hydroelectric power stations;
p2. Hourly data were used;
p3. Where a peak flow was recorded outside a full hour, this flow value was recorded as the nearest full hour;
p4. The travel time (propagation) of the high-water wave was estimated to the nearest hour, based on the length of the section, the location of the section, an estimate of the wave propagation speed based on experience from similar events, and the values used in the hydrological model (source 16);
p5. No account was taken of a possible change in the wave shape during the propagation of the high-water wave;
p6. To determine the discharge hydrograph for unobserved catchment areas, a recorded discharge hydrograph from such an area was selected, which was assessed to be, amongst the available areas, most comparable to the unobserved catchment in question. The recorded hydrograph was linearly transformed into a hydrograph for the unobserved catchment using a factor, which was determined on the basis of the ratio of catchment areas and the ratio of average precipitation between the measured catchment and the unobserved catchment (Fm/Fn * Pm/Pn);
p7. The calculation was carried out using a spreadsheet (Microsoft Excel) with the input hydrograph from the Amlach gauging station on the Drava;
p8. Key to symbols: KW, HE … hydroelectric power station
p9. The results are presented in the form of discharge hydrographs at cross-sections of hydroelectric power stations, gauging stations and unobserved areas;
p10. The symbols used after the name of the cross-section mean: “_d”
… calculated “actual” hydrograph “
_n” … calculated “natural”
hydrograph; no symbol … indicates that the hydrograph was recorded
in an unmonitored area … the name of the hydrograph consists of the correlation factor, the name of the correlation hydrograph and the area number
Conclusions
Operations at the hydroelectric power stations on the Drava have altered the shape and peak of the discharge hydrograph. The changes are already noticeable at the Rožek-Šentjakob HPP in Rož. However, the most noticeable changes are those resulting from operations at the Annabrücke hydroelectric power station (KW ANNABRÜCKE) and, even more so, at the Kazaze hydroelectric power station (KW EDLING).
The difference in the increase in the Drava’s flow rate due to the operation of the chain of hydroelectric power stations across the national border is between 650 and 750 m³/s.
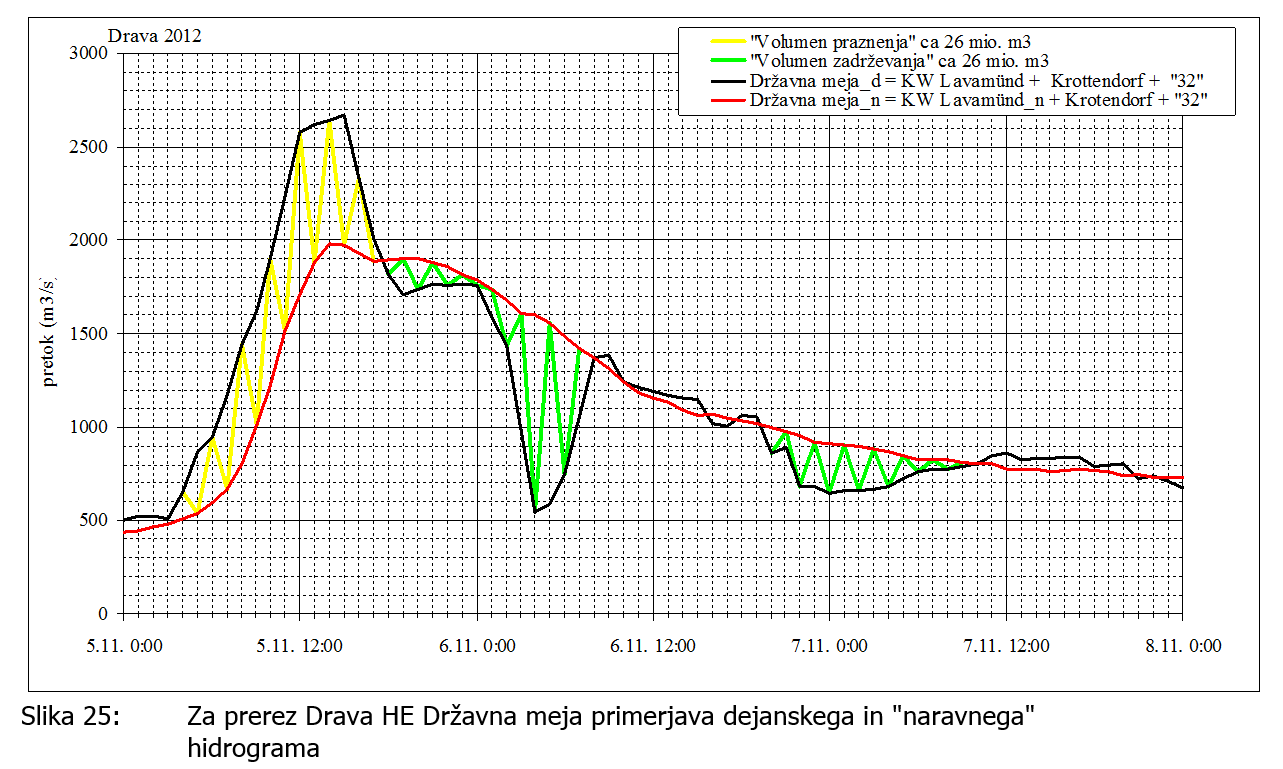
The shape of the Drava’s hydrographs (actual and so-called ‘natural’) at the national border cross-section is confirmed by a balanced assessment of the discharge volume (26 million m³) and the storage volume (26 million m³) of the hydroelectric power station chain’s reservoirs, as shown in Figure 25. The effect of the “discharge” from the reservoirs is evident on 5 November 2012 between 3.00 and 17.00; the effect of the “filling” took place in two stages and is evident from 17:00 (5 November) to 08:00 (6 November) and from 20:00 (6 November) to 10:00 (7 November)
At the national border, the estimated actual maximum flow is 2,670 m³/s with a return period of approximately 100 years, whilst the expected ‘natural’ maximum flow is 1,980 m³/s, which would have a return period of less than 20 years.
At the Vuzenica hydroelectric power station (below the confluence of the Meža and Drava rivers), the estimated actual maximum flow is 3,060 m³/s with a return period of approximately 400 years, whilst the expected ‘natural’ flow is 2,360 m³/s, which would have a return period of approximately 40 years.
Keywords
About the project
REPUBLIC OF SLOVENIA MINISTRY OF AGRICULTURE AND THE ENVIRONMENT
Darko Anzeljc
#Branko Damjanovič #Tina Mazi
OTHER DOMESTIC REFERENCES
